Revenue & Stats
Accessing analytics
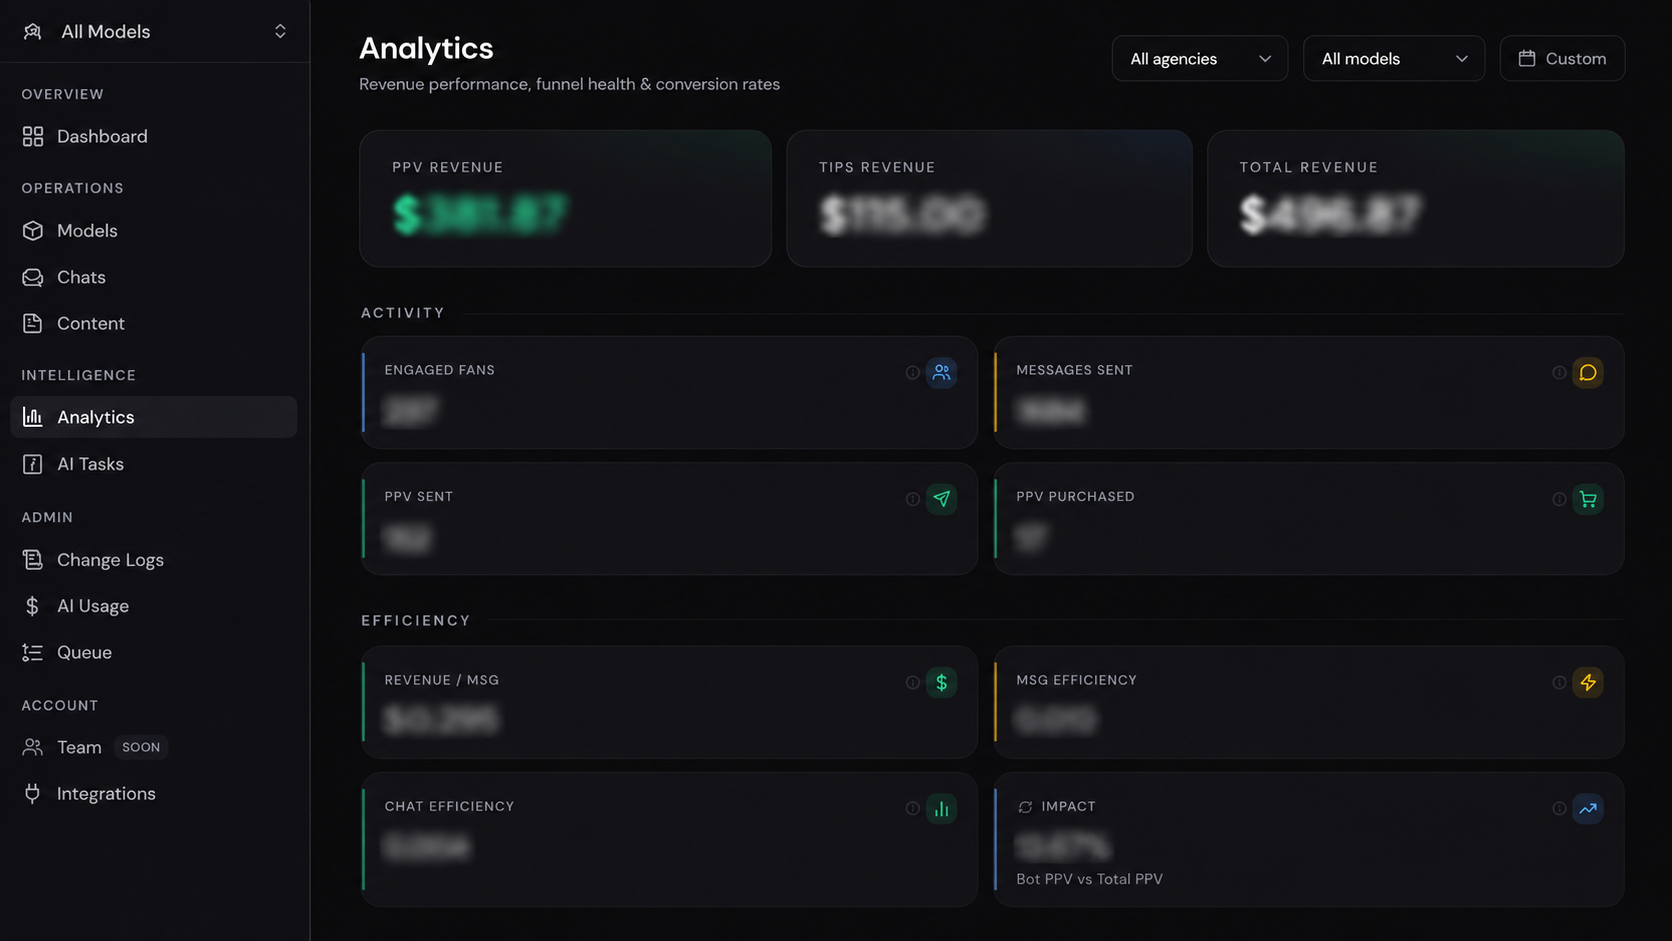
Section titled “Accessing analytics”Go to Analytics in the agency sidebar (listed under Intelligence). This opens the full revenue and stats dashboard.
Filters
Section titled “Filters”At the top of the page you can narrow the data:
- Model — select a specific model or view all models combined.
- Date range — pick the time window to analyze.
- Agency (admin only) — filter across multiple agencies.
Revenue metrics
Section titled “Revenue metrics”The top section shows revenue broken down by type:
PPV Revenue
Total earnings generated from PPV messages.
Tips Revenue
Total earnings generated from direct tips.
Total Revenue
Combined revenue from PPV messages and tips.
These are displayed as totals and in a stacked bar chart over time, so you can see day-by-day trends.
Activity & efficiency metrics
Section titled “Activity & efficiency metrics”Below revenue you’ll find operational metrics:
- Messages sent — total outgoing messages from the AI.
- Conversations started — new threads opened in the period.
- PPV conversion rate — percentage of fans who bought after receiving a PPV offer.
- AI efficiency — ratio of revenue generated to messages sent.
Fan funnel
Section titled “Fan funnel”The funnel visualization shows the drop-off at each stage of the fan journey:
- New subscribers
- Fans who received a message
- Fans who replied
- Fans who received a PPV offer
- Fans who purchased
Use the funnel to identify where fans are dropping off and optimize accordingly.
PPV messages table
Section titled “PPV messages table”A detailed table at the bottom of the page lists every PPV message sent in the period. Columns include:
- Fan name / ID
- Content folder
- Price
- Status (sent / purchased / expired)
- Timestamp
Click any row to jump directly to that fan’s conversation in the Chats view.
Refreshing the table
Section titled “Refreshing the table”Click the Refresh button to pull the latest data. The table may lag slightly behind real-time.
Pagination
Section titled “Pagination”Use the pagination controls at the bottom of the table to navigate through large result sets.